Applications
Examples
|
|
|
|
|
|
|
|
|
|
|
|
|
|
|
|
|
|
|
|
Transaction
data management
Publishers
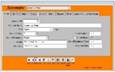
Rep Account entry/edit
Basic
screen to enter, edit and lookup information in a multi-user environment. Easy to use.
Customer
Service operator form

Customer
service operators use this form to initiate action to resolve returns, refunds,
damages, non-deliveries, etc.
Data
collected here feeds into refunds report, mailing labels, packing slips,
etc. Multi-user LAN.
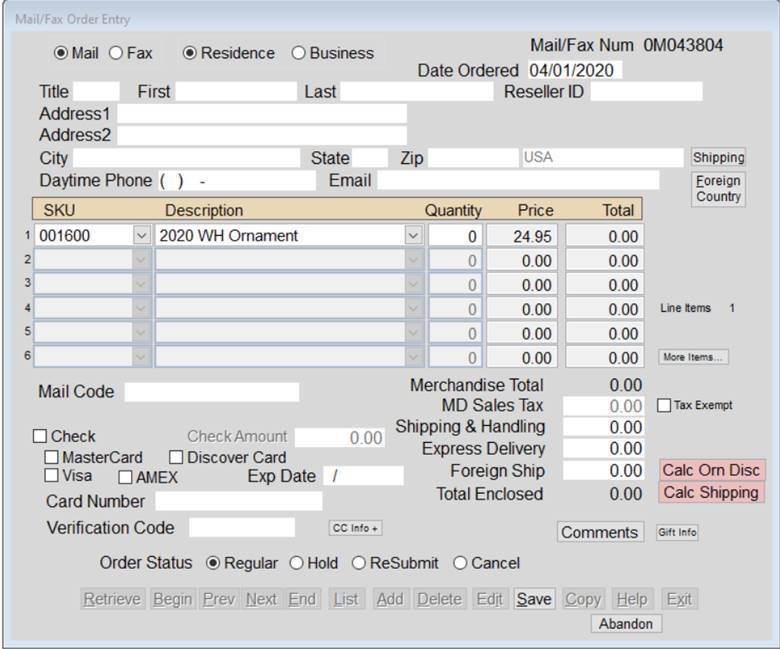
Mail Order operator form #1
Operators use
this form to collect info for mail and FAX orders (yes, FAX).
This data from this
screen will be used to generate all information needed to ship the order.
Mail Order
operator form #2 –
Validation
Attempting to Save an
incomplete order:
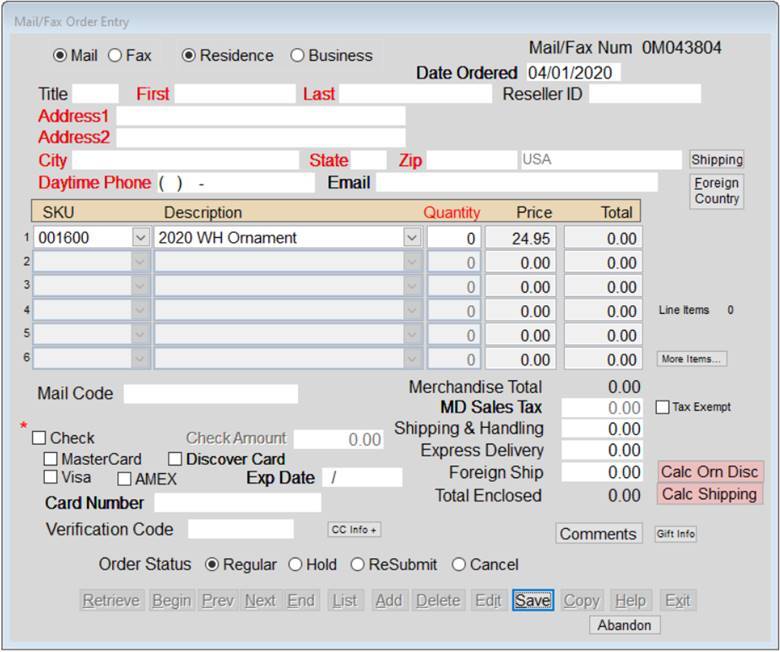
Extensive data
validation catches missing vital data.
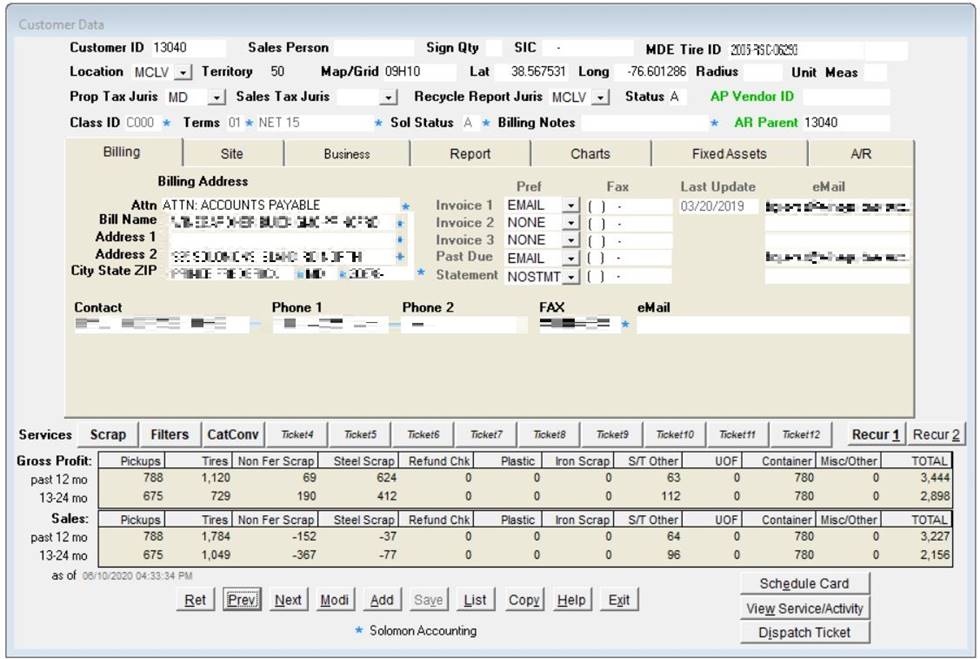
Industrial
Strength Multi-use screen

Complex form
serves as the “command center” for customer info. It integrates multiple
systems and functions
including SQL
Server-based accounting, services, scheduling, sales history, detailed
activity,
customer
invoices, asset management, external reporting, contracts, and more.
Packing
Slip/Mailing Label
Up to 4,000
orders per day during peak season, this label is a part of a much larger
system that
gathers orders daily from web, the 800-number call center and Amazon.
Generates a USPS
IMpb scannable tracking number, creates manifest
files for
FedEx and USPS.
Mailing List
Effectiveness
All
Customers
This for a
large mailing campaign that relies on internal and purchased lists. This measures list effectiveness.
The first step to
determine mailing list cost-effectiveness.
Likely New
Customers
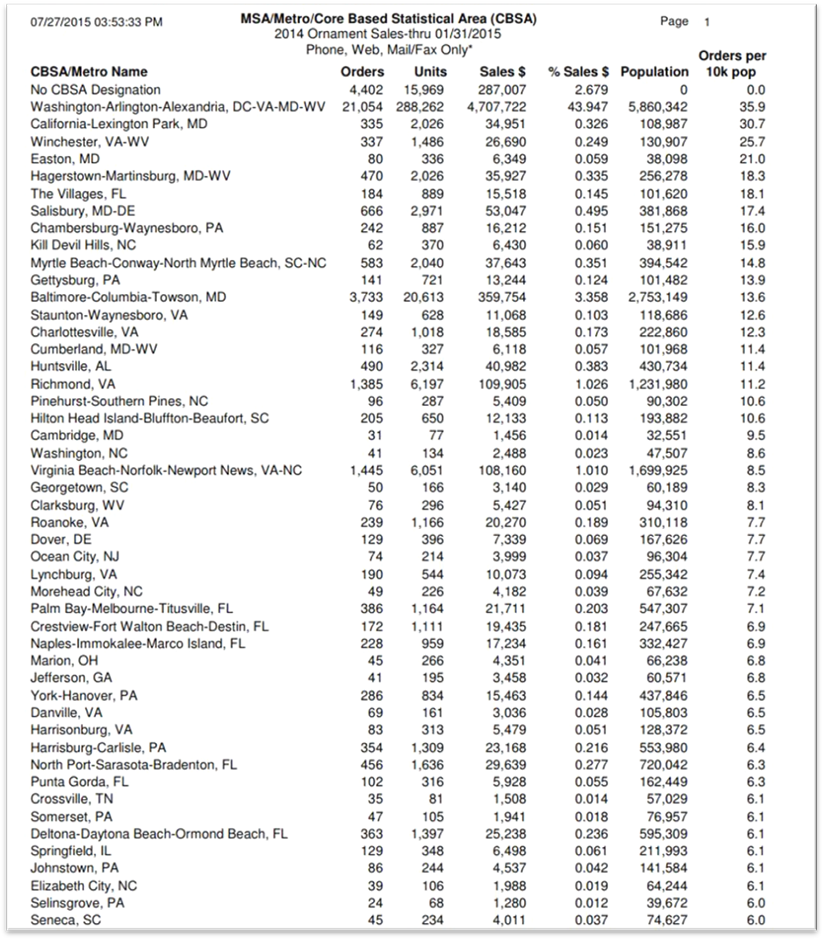
Sales by
Metro Region
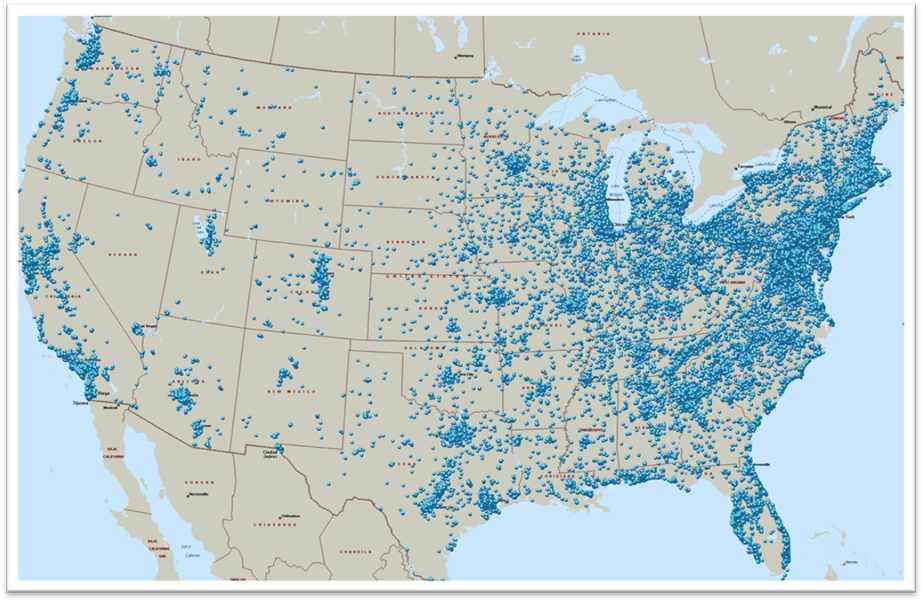
Where are the
customers located?
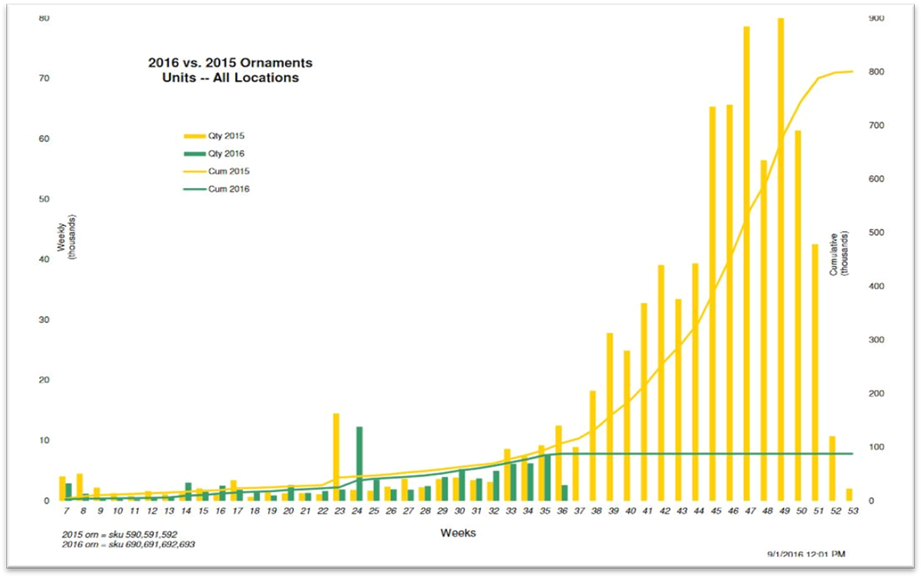
Weekly TY vs
LY YTD

Highly seasonal
single product
One chart can
answer the questions:
"What
happened?", "What is happening now?", and "What is likely
to happen?"
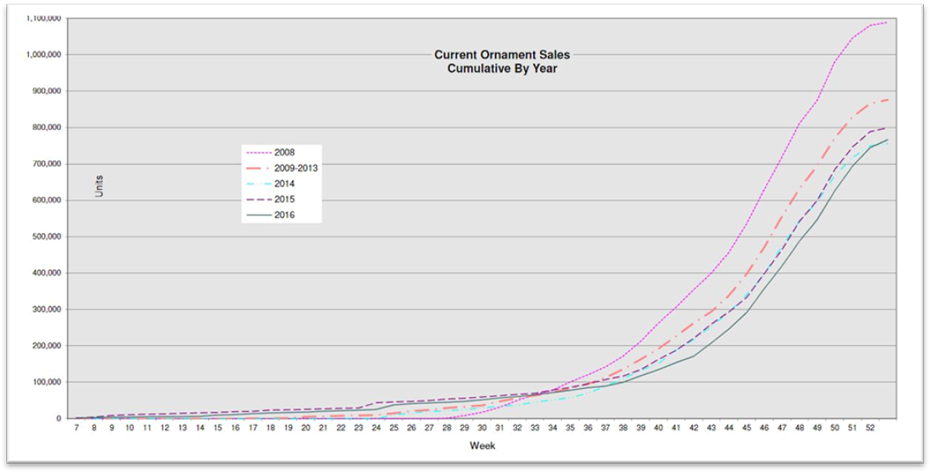
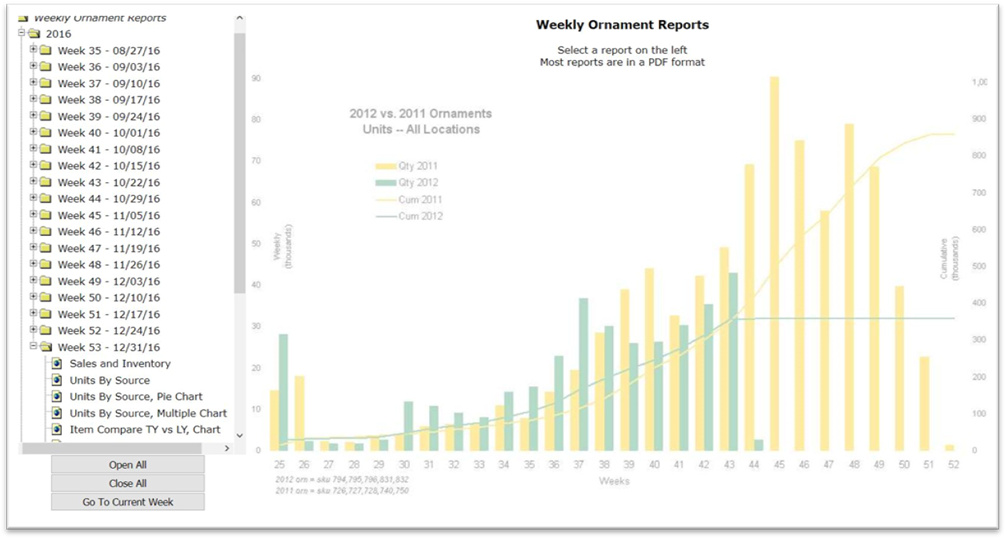
Multi-Year
weekly comparison

Week by week
cumulative comparison between years.
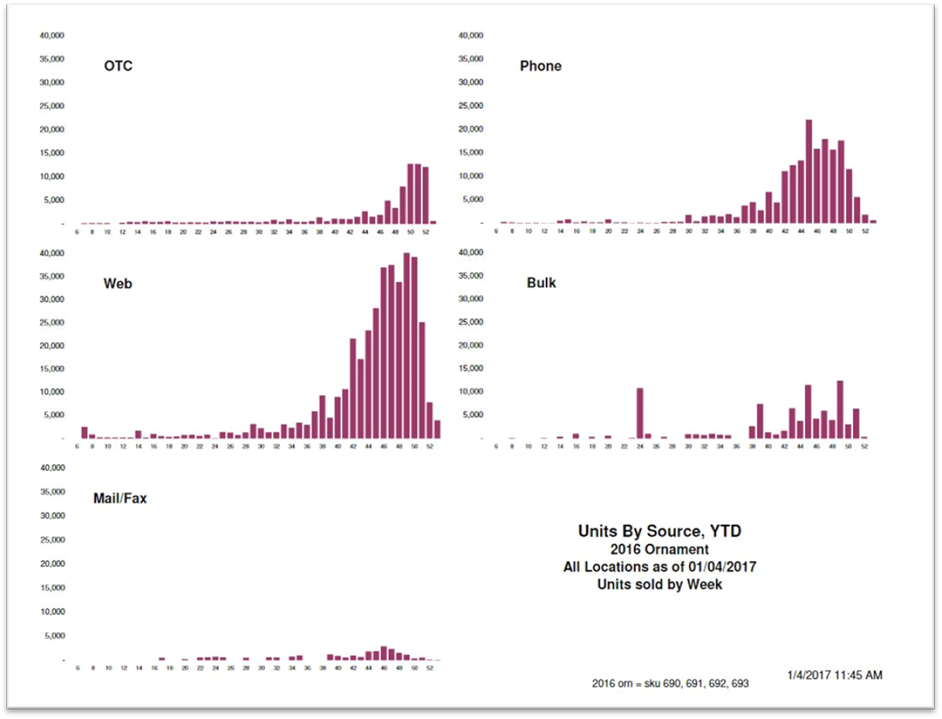
Weekly Sales
by Source

Comparing
weekly sales by sales source. OTC is over-the-counter retail.
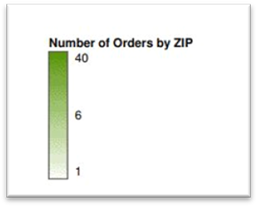
Map –
Regional Sales by Zip
Map – All
orders by Street Address

A
dozen weekly summary reports. Access from any browser. PDF format for easy
on-line viewing and printing.

Let us create
your cloud application.
Our high speed,
state-of-the-art servers utilizing solid state drives and blazingly fast
connections
will give your
applications zip that will surprise you!
What?
Like, this
isn’t enough?
Seriously?